Page speed is one of the most important factors in SEO and user experience. Using this guideline, one of our clients decided to focus on this metric and work on improving the site’s speed to see if it increases conversions and customer retention. As you will soon see, the first task was to create a dashboard to help us monitor website performance.
46 years ago, Miller wrote:
The basic advice regarding response times has been about the same for thirty years [Miller 1968; Card et al. 1991]:
- 0.1 second is about the limit for having the user feel that the system is reacting instantaneously, meaning that no special feedback is necessary except to display the result.
- 1.0 second is about the limit for the user’s flow of thought to stay uninterrupted, even though the user will notice the delay. Normally, no special feedback is necessary during delays of more than 0.1 but less than 1.0 second, but the user does lose the feeling of operating directly on the data.
- 10 seconds is about the limit for keeping the user’s attention focused on the dialogue. For longer delays, users will want to perform other tasks while waiting for the computer to finish, so they should be given feedback indicating when the computer expects to be done. Feedback Pduring the delay is especially important if the response time is likely to be highly variable, since users will then not know what to expect.
https://www.nngroup.com/articles/response-times–3-important-limits/
When I’m about to work on performance improvements, the first question I usually ask is what is the current behavior and how can I measure changes.
We started debating on which tool would be best to monitor the performance. That’s when one of the developers asked, Why not use Google Analytics? It’s already collecting the data and allows us to set alerts and even make a correlation between performance and conversions.
Monitor Website Performance Using Google Analytics
The first place to look at is the Site Speed Overview dashboard. It is located under “Behavior”-> “Site Speed”.
The dashboard shows you site speed statistics of your entire website.
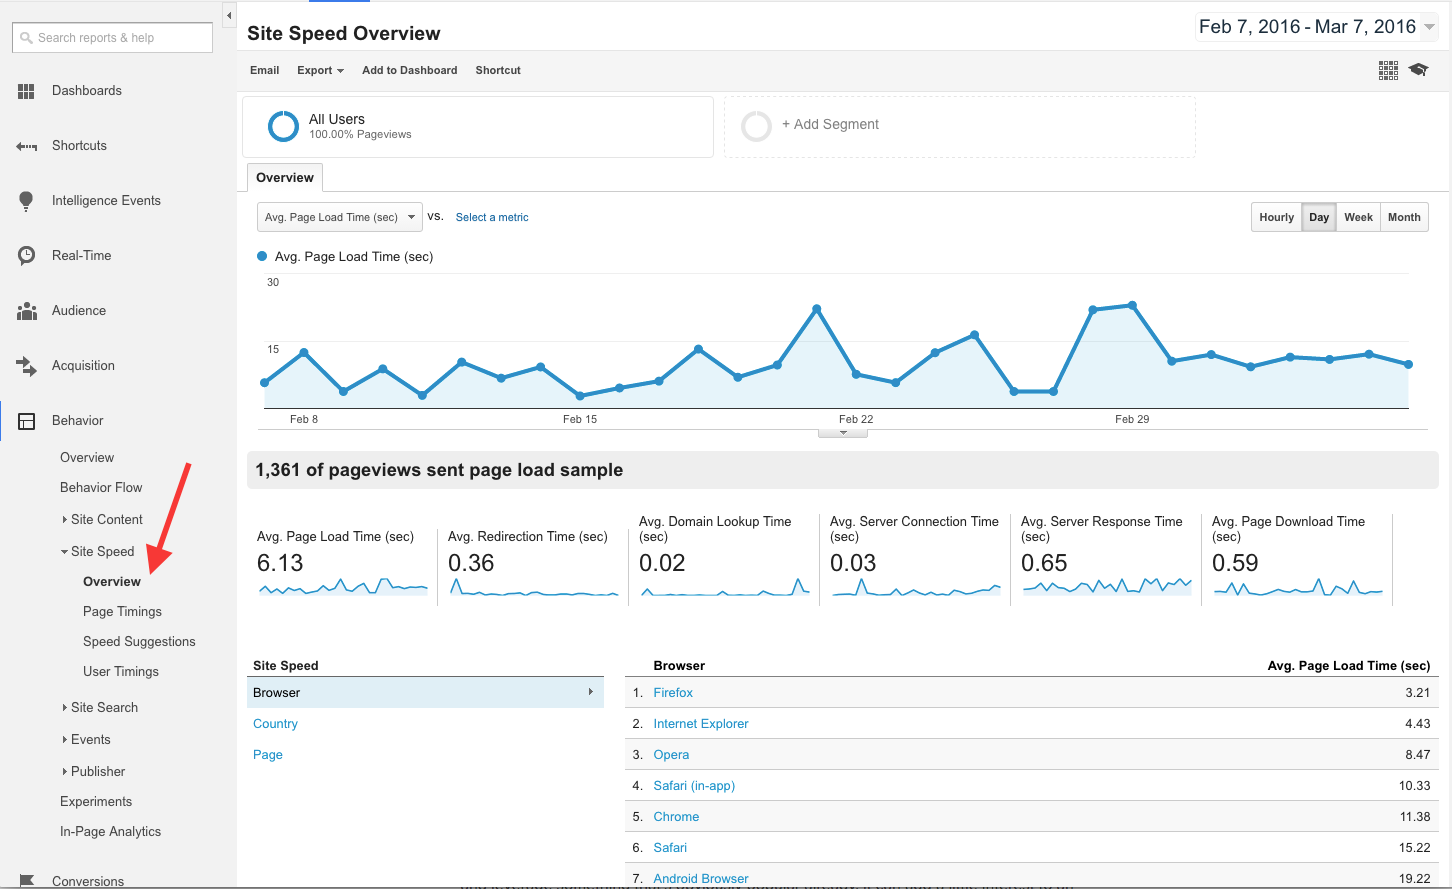
Here are some interesting stats to look at:
* Avg. Page Load Time – This is the main thing to look for. It sums up the user experience and includes the loading of the page, rendering and script execution.
* Avg. Server Response Time – Shows you response time from the servers. It includes the network layer and the backed execution time.
* Avg. Page Download Time – The time it took for downloading the content. Later on, when we examine performance tuning, this is what minification improves.
Looking at the dashboard, you may see some peaks in performance and detailed information about each browser, but to paint a better picture, it is useful to make a comparison with the previous period. You can do that by clicking the time frame and select compare to the previous period.
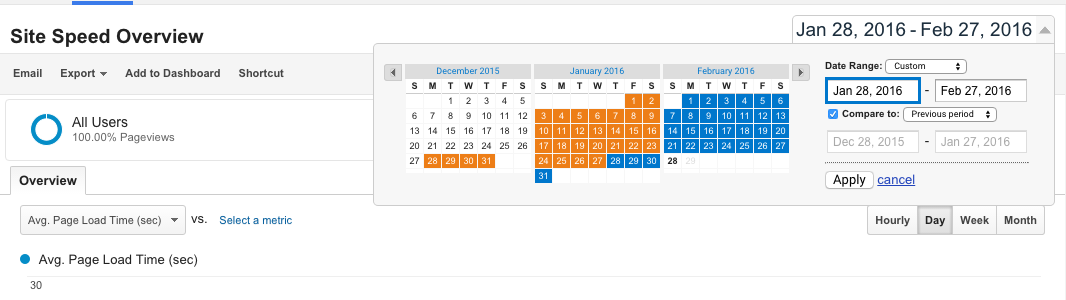
Now you can see some reference to how you are doing. Did performance improve or decline from the previous period?
Note that google uses the green color to indicate improvement and red for a deterioration. It can be a bit confusing because the arrows and color show the opposite of the numbers. Trust your instincts on this one.
Creating the performance dashboard
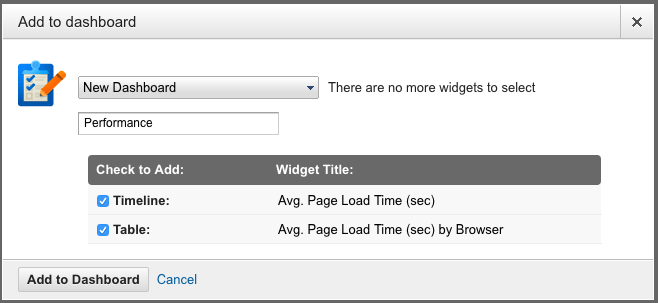
At this point, you can create a new performance dashboard or use an existing one and add the current chart –
Click the add to dashboard button, select new dashboard, name it, and check the Timeline and Table options.
You will be taken to the new dashboard screen where you customize the layout and the widgets.
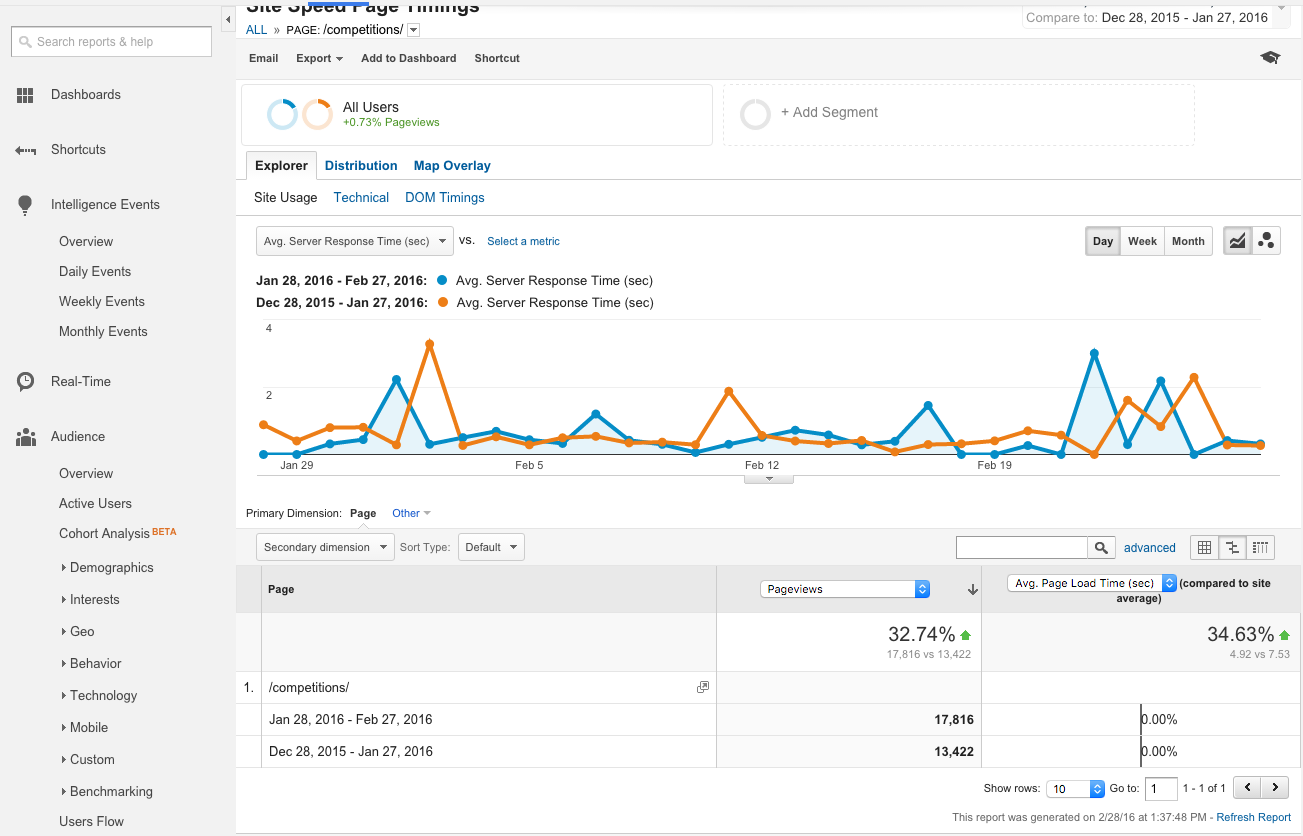
Viewing the page speed of specific pages
We can now drill down a bit and see how specific pages perform.
Let’s say that the best converting page on our website is the “competition” page.
Any performance issues on that page can cause a drop in sales. Ouch, we definitely don’t want that.
Open up the Page Timings report under Site speed and select click the page you want to look at.
You can see the same stats as before, but, this time, they are specific to this page.
Creating an email alert
You can use this information to gather your baseline for expected behavior. Take a look at your average page speed and look at the chart for peaks and trends.
Let’s say that the average page load time is 5.43 seconds and you see peaks hitting 8s. We want to be notified whenever this average crosses our desired top line, for the sake of this example, we want to be notified when it reaches 8s.
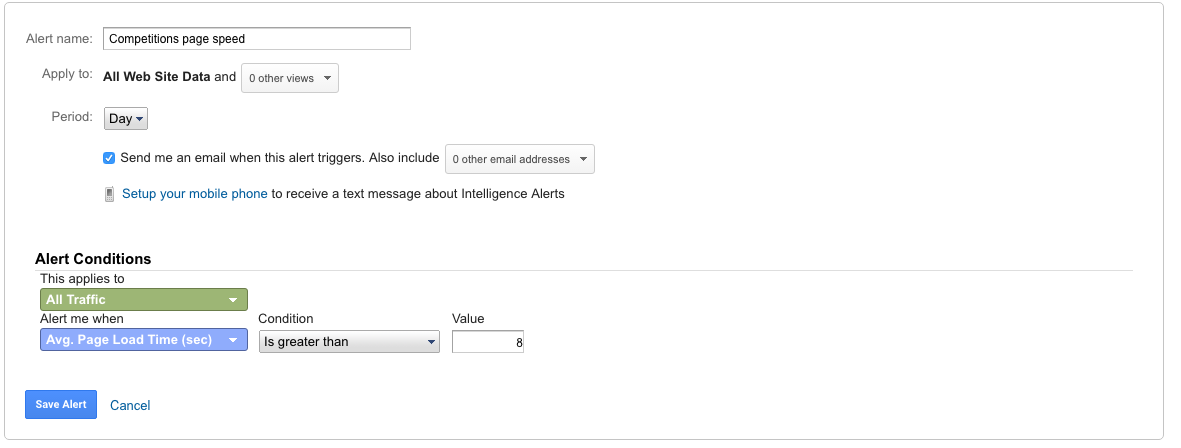
To create the alert, go to the admin tab, and on the view column, click the Custom Alerts option.
Create a new alert, set a name and select the following:
* Period – Day. We want to be alerted of anomalies and suspicious behavior. You can, later on, create an alert for longer periods.
* Check the send me an email checkbox and select an email address
* Under alert conditions, keep the All Traffic selection
* Change the “Alert me when” option to Content-> Avg. Page Load Time (sec).
* Set the condition to “Is greater than”
* And finally set the value to 8.
As you can see there are a lot of options for alerts. If we were to work with a longer period, we could use a percentage increase or look at completely different stats.
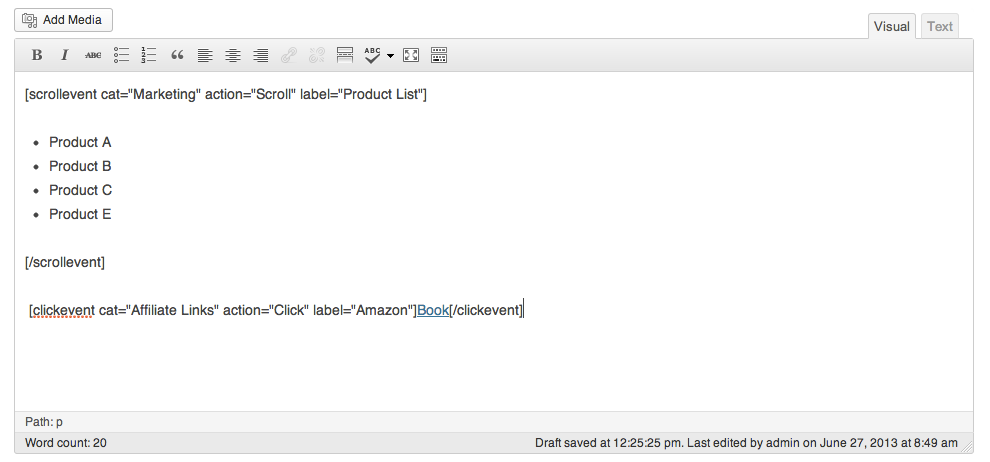
In the next post, we will see how to increase the speed of WordPress based websites using plugins.


